Band Map
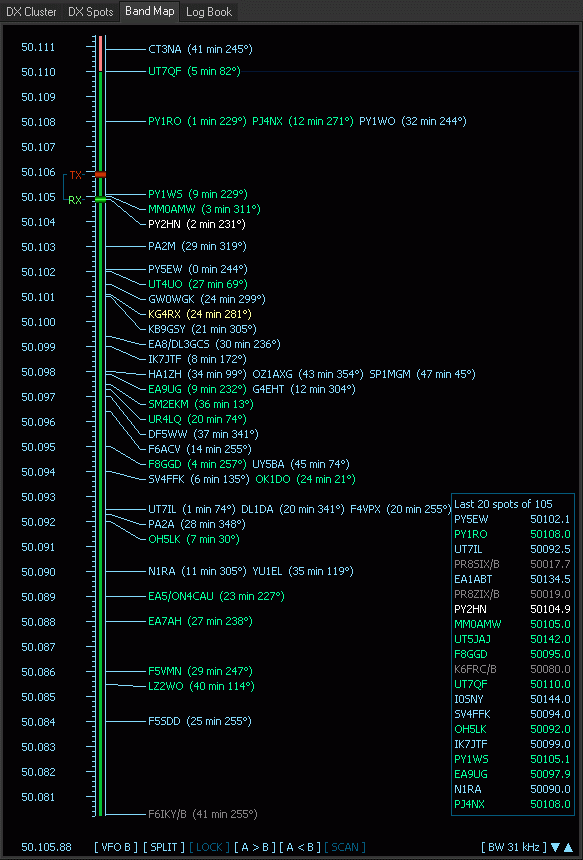 Compared to the real radio FTDXRC offers several benefits. One of them is the Band Map to show DX Spots and to tune Main VFO A and/or Sub VFO B. The Band Map is filled with DX spots after you connect to a Telnet DX Cluster. This gives you a good overview of what's happening on the band. It allows scaling to be able to zoom in and out. The displayed bandwidth of the scale is shown in the bottom right edge.
Use keyboard shortcut Ctrl+A to set the focus into the Band Map to be able to tune up and down the band using the mouse or the keyboard. The Main VFO A caption will highlight. You can click into the Band Map but it's not necessary, it receives the focus automatically after Ctrl+A.
Use keyboard keys Up or Down to slowly fine-tune VFO frequency A or B or the keyboard keys Page Up or Page Down to faster tune the VFO frequency. The green RX bar shows the VFO A frequency.
You can also use your mouse to tune the frequency by dragging the green bar if you move your mouse up and down in the left part of the Band Map. The cursor changes to a cross.
The red TX bar shows the VFO B transmit frequency if you work split and the blue bar the QSX offset. This can be helpful not to accidentaly cover another station with your TX signal.
If you hold the mouse over a DX Spot the cursor changes to a hand symbol and the full DX spot information is shown at the bottom. Double-click on the DX spot, frequency A is then changed to the frequency of the spot.
Besides that the last 20 spots on that band are shown in a box.
The DX Spots have a certain lifetime as set in the Settings, e.g. 60 minutes. They are not shown in the Band Map anymore when the lifetime of a spot has exceeded. The lifetime and visability of a spot is prolonged with each new spot of the same DX call. If the DX changes frequency the spot moves to the new frequency as well - a DX spot is shown only once in the Band Map.
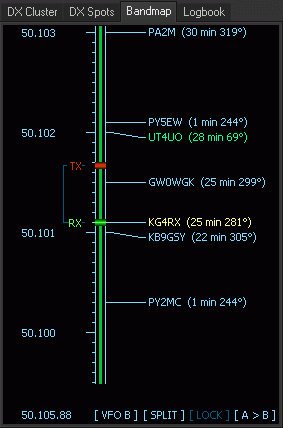
 The spots are shown in different colors. You can insert your own spots (higlighted in white) into the DX Spots Tab and Band Map by entering a call sign in the Log Window and by hitting Ctrl+Enter. The exact Frequency A and B and Split status are stored and can be recalled (as for all other spots) by either double-clicking on a spot.
Band segments are displayed in green for CW, red for Phone and yellow for Digital modes. The Band Plan can be changed in the Settings (Settings > DX Cluster > Band Plan).
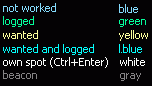
![]() The Band Map has little blue arrows in the bottom right edge to be able to scale the display resolution (bandwidth) up or down.
The Band Map has little blue arrows in the bottom right edge to be able to scale the display resolution (bandwidth) up or down.
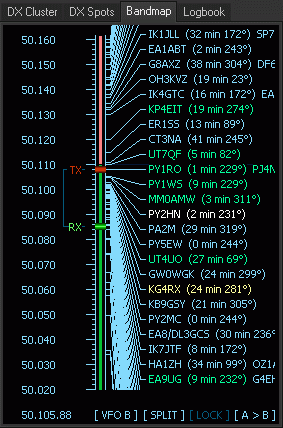 |
Alternatively use the Left key for a lower scale or the Right key for a higher scale. If you use a lower scale the frequency dial steps will be lower as well. It may vary from 1Hz with the lowest scale and 1 kHz or 10 kHz with the highest scale. This helps you to faster and more precisely tune to a station. To change Frequency Control from VFO A to VFO B and vice versa click on the VFO button. Click on the Split and Lock buttons to toggle the split and respectively the lock function. A > B sets VFO B to the same frequency (and mode) as VFO A and vice versa for the B > A button. |
|
Back to Documentation > Operating | Next: Logging